An A/B test in marketing is a controlled comparison between two versions of a single marketing element: you build version A and version B, show each to a randomly assigned, comparable slice of the same audience at the same time, and measure which performs better on one metric chosen before launch. A result is reliable only when three conditions hold together: exactly one element differs between versions, assignment is random and simultaneous, and the sample is large enough - decided in advance - for the observed gap to clear the 95% significance threshold rather than reflect ordinary random variation.
Most marketing tests fail on the third condition. The mechanics are easy - almost every email platform, ad system, and page builder ships with a testing feature. What separates a finding you can act on from a number that quietly misleads six months of work is the discipline around it: the hypothesis written before you looked at data, the sample size you committed to, and the honesty to call an inconclusive test inconclusive.
What an A/B test actually measures
A/B testing applies the scientific method to a business question: observe a pattern, form a hypothesis about what drives it, design a test that can invalidate it, collect data, conclude. The output is not "which version is better" in the abstract - it is an estimate of how much a specific change moved a specific metric for a specific audience during a specific window.
That framing defines what the test earns you. A landing page test moving conversion from 2.1% to 2.6% does not prove shorter headlines work; it shows this headline beat that one for that month's traffic mix. It also settles arguments: teams without an experimental culture default to the HiPPO problem, where the Highest Paid Person's Opinion decides what ships.
Then decide which metric the test answers to. A useful hierarchy runs from Business metrics (revenue, lifetime value, acquisition cost) through Conversion metrics (conversion rate, cost per conversion) and Engagement metrics (click-through rate, time on page) down to Awareness metrics (impressions, reach). Test against the highest level you have the volume to measure, then apply the "so what?" test: what decision would change if this number moved? If nothing would, you are about to spend three weeks measuring a vanity metric.
HVMA: design the whole test before you run it
The HVMA framework - Hypothesis, Variables, Methodology, Analysis - turns a split test into an experiment. Every element is written down before traffic flows, because each is a place where post-hoc rationalization can bend the result toward what you hoped to find.
| Step | What you write down | Typical mistake |
|---|---|---|
| Hypothesis | "If we change X, then metric Y will increase or decrease by an estimated amount, because of this reasoning." | "Let's see if a new headline does better." No direction, no size, no reasoning - any outcome reads as success. |
| Variables | The independent variable you change, the dependent variable you measure, the controls you hold constant (traffic source, offer, send time). | Changing headline and button color at once, with no way to attribute the lift. |
| Methodology | Required sample size, planned duration, how audiences get split, which tool records the data. | Launching with "we'll run it a week," then finding the week produced 400 visitors against a requirement of 18,000. |
| Analysis | Which statistical test applies, the confidence level required, what happens if the result is inconclusive. | Setting the analysis rules after seeing the numbers, which reliably produces the answer you wanted. |
The hypothesis carries most of the weight. Weak: "Testing whether a shorter form converts better." Strong: "If we cut the signup form from seven fields to three, then completion rate will increase by roughly 25%, because each added field adds friction and 61% of abandonments happen after the fourth field." The second predicts a direction, an amount, and a mechanism. If completion rises only 4%, that is still informative - the friction theory holds, but the effect is smaller than the redesign cost justifies. Specific hypotheses produce actionable insight regardless of outcome, which is why negative results are worth as much as positive ones.
The statistics that decide whether a result is real
Four concepts decide whether your test produced knowledge or noise. None require advanced mathematics, and ignoring any one can invert your conclusion.
| Concept | What it means | What goes wrong if you ignore it |
|---|---|---|
| Statistical significance | The probability the observed difference is not random chance. Standard threshold: 95% confidence, under a 5% chance the gap appeared randomly. | You ship a "winner" at 78% confidence and watch the lift evaporate. |
| Confidence interval | The range the true value likely sits in. A rate of 3.2% plus or minus 0.8% means the real rate is likely between 2.4% and 4.0%. | You report 3.2% as fact and forecast revenue on it, when the honest range is wide enough to change the business case. |
| Sample size and power | Power is the probability of detecting a real difference when one exists. Larger samples narrow intervals and raise power. | An underpowered test misses a genuine 12% improvement, so you discard a winning variation. |
| Effect size | The magnitude of the difference, independent of whether it is significant. | You spend a quarter rebuilding templates for a real but tiny 0.1% gain that never repays the work. |
Sample size is the step people skip, so work it through. Suppose a landing page converts at 2.1% and the smallest improvement worth acting on - the minimum detectable effect - is a 20% relative lift, taking conversion to 2.52%. At 95% confidence and 80% power, that needs roughly 18,000 to 19,000 visitors per variant, about 37,000 total. A page receiving 4,000 visitors a month needs four months. That is not a reason to skip the test; it is what you needed to know before promising results by Friday.
Now halve the ambition. To detect a 10% relative lift instead of 20%, the requirement jumps to roughly 74,000 visitors per variant: sample size scales with the inverse square of the effect you chase, so halving the detectable effect quadruples the traffic needed. Small sites detect big changes quickly and small changes never - a strategic instruction, not a limitation. Test bold variations, not button shades.
Email behaves the same way with different numbers. A list of 20,000 split evenly gives 10,000 recipients per subject line, which against a 2.4% baseline click-through rate detects a relative lift of roughly 25% to 30% but not a 10% one. So a subject line test there should compare genuinely different angles - a question, a benefit statement, a number - not near-identical phrasings. And because Mail Privacy Protection inflates opens, judge those tests on clicks.
Finally, weigh effect size against implementation cost. A page converting 3.2% versus 3.3% at 4,000 monthly visitors differs by four conversions a month. If capturing that means rebuilding a template used across forty pages, a statistically real result is still not worth having.
What is worth testing on each channel
Channels differ in volume, feedback speed, and what counts as success. Applying the wrong criterion - judging email by impressions, or paid media by engagement rate - yields confident conclusions about the wrong thing.
| Channel | High-value elements to test | Primary metric |
|---|---|---|
| Landing pages | Headline, form length, offer framing, one call to action versus two | Conversion rate, plus cost per conversion on paid traffic |
| Subject line angle, sender name, body length, one link versus several | Click-through rate and click-to-open rate, not open rate | |
| Paid media | Creative format, hook in the first three seconds, audience definition | Cost per acquisition, checked against return on ad spend |
| Organic social | Format (carousel versus single image), hook style, posting time | Weighted engagement, scoring comments and saves above passive likes |
| SEO and content | Title tags on high-impression, low-CTR pages; content depth; internal links | Click-through rate from search, then organic sessions |
A social example: "Carousels will generate twice the engagement of single images on matched topics, because they increase time spent." Run five of each over two weeks and compare weighted engagement, not raw likes. A title tag example: pick five pages with high impressions and below-average CTR in Search Console, rewrite the titles, measure CTR over four weeks. Neither is a textbook randomized test; both are legitimate experiments if the write-up says so.
The mistakes that invalidate a test
Each item below does not merely weaken a result - it makes the number unusable.
- Peeking and stopping early. The premature conclusion trap is the most common way marketing tests go wrong. Small samples fluctuate wildly: a result that looks like a 30% improvement after 50 observations can normalize to 3% after 500. Calling the winner the moment the dashboard line crosses is waiting for noise to flatter you. Commit to the sample size and duration first.
- Changing several things at once. If version B has a new headline, a new image, and a shorter form, a 15% lift says nothing about which change produced it - or whether one element gained 25% while another lost 10%.
- Running A and B in different weeks. Sequential testing confounds your variable with time: a payday week, a competitor's promotion, or a holiday shows up as if your variant caused it. Both versions must run simultaneously so temporal factors hit each equally.
- Non-random assignment. If your tool sends desktop visitors to A and mobile to B, you measured device, not your change. Most tools randomize automatically - verify yours does not route segments systematically.
- Samples too small to say anything. Two hundred visitors per variant always produce some difference, because two samples never match exactly - but with a confidence interval wide enough to include zero and its own opposite.
- Unfiltered internal traffic. Your own visits and QA submissions inflate pageviews and drop fake conversions into the data. On a page with 4,000 monthly visitors, thirty internal sessions and three test form fills are enough to move the measured rate. Set IP filters before the test.
- Inconsistent naming. "Spring_Sale_2026" and "spring-sale-26" register as two separate campaigns, splitting one dataset into two undersized halves and pushing both below significance.
- Choosing the metric after the fact. Look at ten metrics and report the one that moved, and you have run ten tests at 95% confidence and cherry-picked the winner. A false positive is then likely rather than unlikely.
When A/B testing is the wrong tool
A/B testing has preconditions: enough volume, a change small enough to isolate, and an effect that appears inside your test window. When those fail, a split test produces a confident number built on nothing.
- Low traffic. A page drawing 300 visitors a month at 2% conversion produces six conversions, and no test design rescues that. Use qualitative methods (session recordings, interviews, support tickets), make larger changes measured as pre/post, or pool similar pages into one test.
- Brand-level or full-redesign changes. A new visual identity cannot be split-tested cleanly. Use pre/post analysis: measure a stable baseline, implement, measure after, explicitly accounting for seasonal trends and external events.
- Effects that take months to appear. Retention, lifetime value, and loyalty do not resolve inside a two-week window. Use cohort analysis: track users who signed up in January against those from February and follow how behavior evolves.
- Questions with interacting variables. Multivariate testing covers all combinations at once: headline A with image A, A with B, B with A, B with B. It reveals interaction effects a sequence of A/B tests would miss, at the cost of far larger samples.
- Exploratory questions with no hypothesis yet. Use correlation analysis first. Does posting frequency track with follower growth? Correlation does not establish causation, but it generates hypotheses worth testing under controlled conditions.
Clean data is a precondition, not a chore
Every insight drawn from dirty data is potentially wrong, and every decision built on it inherits the error. Data hygiene is what makes experiments trustworthy.
- Verify tracking before the test. Confirm the analytics code fires on every page, complete the conversion action yourself, and check it appears in real-time reports. An event firing on page load rather than form submission reports a rate near 100% and takes weeks to catch.
- Enforce naming conventions. Standardize campaign names, UTM parameters, and labels before launch. Fragmented labels are a quiet reason tests never reach significance.
- Exclude internal traffic permanently with IP filters, so test transactions never contaminate conversion data.
- Audit monthly. Review data for unexplained traffic spikes, conversion shifts matching no site change, or engagement inconsistent with the content. Anomalies more often indicate tracking errors than genuine performance shifts.
One habit compounds all of this: document every test in a single tracker - hypothesis, methodology, sample size, results, insight. Undocumented experiments produce feelings about what works; documented ones produce knowledge that transfers between projects and teams. A log of fifteen to twenty recorded tests shows more analytical discipline than any single impressive result.
Frequently asked questions
How long should an A/B test run?
Long enough to reach your predetermined sample size, and never fewer than seven days, so every weekday and weekend appears in both variants. If your calculated sample arrives in three days, run to seven anyway - Tuesday traffic and Saturday traffic behave differently. If it takes eleven weeks, run eleven weeks or redesign the test around a larger expected effect. Duration follows from the arithmetic, not the reporting calendar.
How large does the sample need to be?
It depends on your baseline rate and the smallest lift worth acting on. Use a free sample size calculator with three inputs: baseline conversion rate, minimum detectable effect, and confidence level (95% is standard). At a 2.1% baseline chasing a 20% relative lift, expect roughly 18,000 to 19,000 observations per variant; higher baseline rates need fewer. Run the calculation before launch and write the number into your methodology.
What if the result is not statistically significant?
Report it as inconclusive and treat that as a real finding. Below 95% confidence you cannot declare a winner, but you have learned the change produced no effect large enough for your traffic to detect - a reason to test something bolder. What you must not do is extend the test until it crosses the threshold, or swap in a metric that did move.
Can I test two things at the same time?
Not within one A/B test - two simultaneous changes make attribution impossible. Either run the tests sequentially so each isolates one variable, or run a multivariate test that covers all combinations and measures interaction effects. Multivariate needs more traffic, since four combinations divide your audience four ways instead of two.
Does a winning test guarantee the improvement will hold?
No. A 95% confidence level means roughly one significant result in twenty is a false positive, and your test measured one audience in one window. Effects also decay - a novelty-driven lift fades as visitors adjust. Monitor the metric for a month after rollout.
How do I present results to people who do not read statistics?
Lead with the finding in one sentence, then the implication, the caveat, and the recommendation. For example: conversion rose from 2.1% to 2.6%, a 24% relative lift at 96% confidence, worth about 20 extra signups a month; the effect was measured only on paid traffic, so organic is unverified; recommend rolling out to paid landing pages and testing organic separately. Stating the limitation openly builds credibility rather than undermining it.
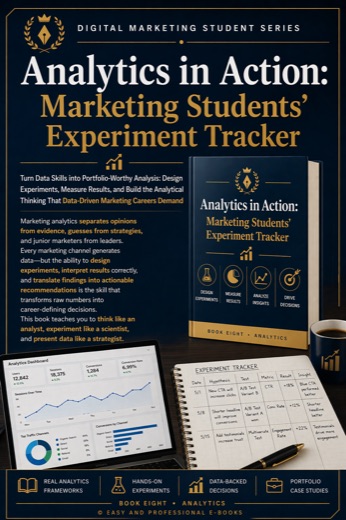
These practices come from Analytics in Action: Marketing Students' Experiment Tracker, the complete guide to designing and documenting marketing experiments end to end. It develops the HVMA framework and the statistical foundations covered here in full, extends them across social, website, email, and paid media analytics, and closes with a 60-day sprint that turns a log of experiments into a portfolio case study.